

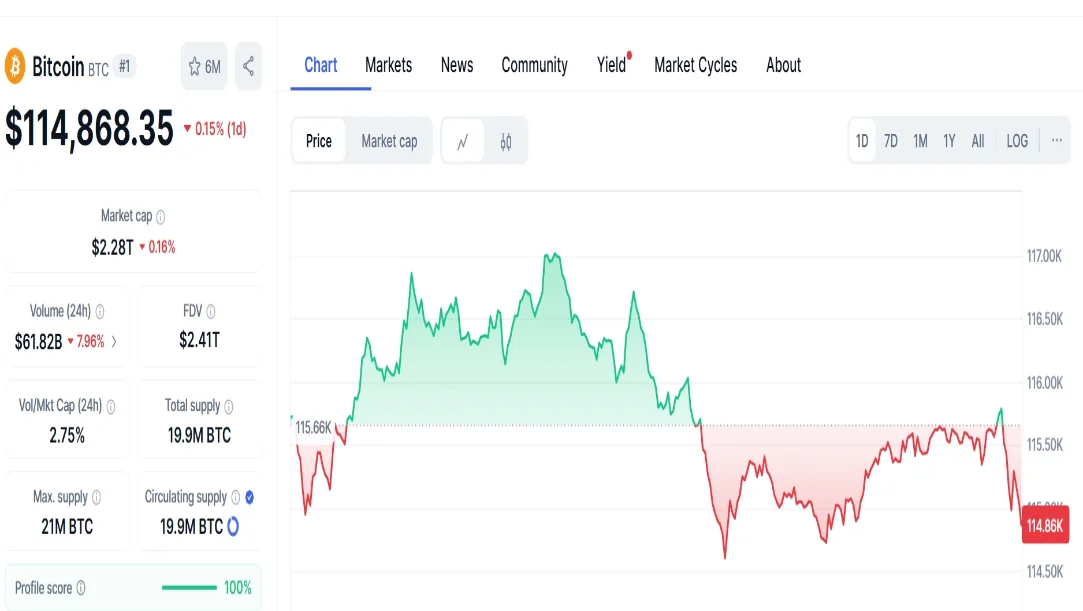
Bitcoin (BTC) is trading at $115,300, down about 7.3% from its mid‑August all‑time high of $124,457. The world’s largest cryptocurrency still commands a market cap of $2.27 trillion and daily trading volumes above $48 billion, but key on‑chain and macro indicators suggest potential turbulence ahead of September.
1. Whale Movements Surge
Blockchain analytics firm Glassnode reported over 28,000 BTC—worth roughly $3.22 billion—moved to exchanges in the past week. Historically, such inflow spikes precede profit‑taking phases.
2. Funding Rates Flip Bearish
Perpetual futures funding rates on Binance and Bybit have dipped to –0.012%, indicating shorts are overtaking longs. This often correlates with increased downside volatility.
3. Miner Capitulation Pressure
Bitcoin’s 7‑day average hash rate fell from 659 EH/s to 619 EH/s in two weeks—a 6% decline. Analysts say prolonged profitability drops could push miners to sell holdings, adding sell‑side liquidity.
4. Macroeconomic Headwinds
The US Consumer Price Index (CPI) for August, due next week, is forecast at 3.1% YoY. A hotter‑than‑expected reading may prompt the Federal Reserve to maintain rates at 5.5%, strengthening the dollar (DXY currently at 104.8), which often pressures BTC.
5. Critical Support Zones
Technicians flag $110,000 as the first major sentiment floor. Breaching this could trigger automated liquidations toward the $100K–$105K range, risking a swift 8–12% drop.
Pro Tip for Traders
Watch exchange BTC reserves (currently 2.05M BTC), open interest (≈ $12.4B), and realized profit/loss ratios for early warning signals.