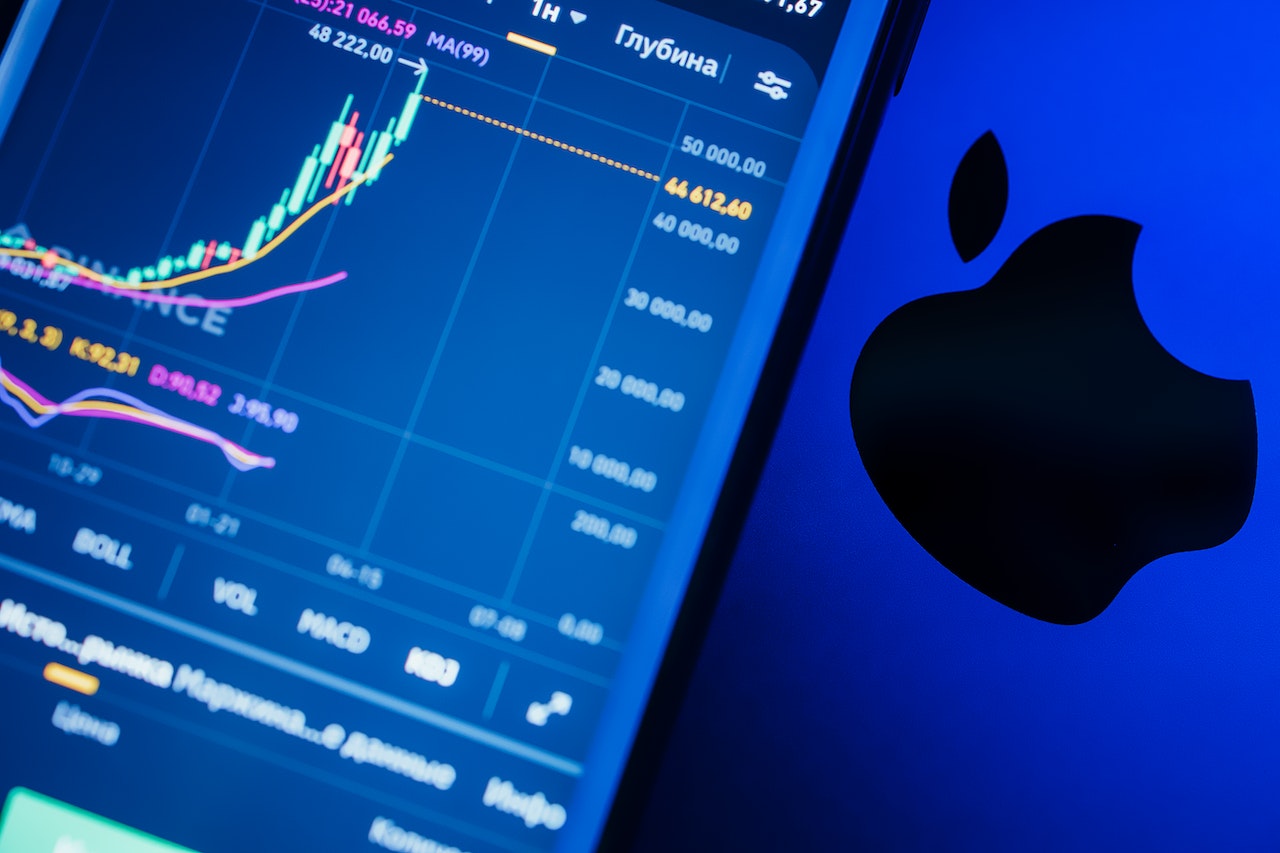
Trading is a promising method to increase your earnings in various markets like stocks and cryptocurrencies. They offer valuable insights into market trends and potential trading prospects, empowering you to make informed choices.
Technical indicators are tools used to analyse market patterns and trends using calculations based on price, volume, and open interest data. The top five indicators are MA (Moving Average), RSI (Relative Strength Index), PSAR (Parabolic SAR), Bollinger Bands, and Fibonacci Retracements. The choice of indicator to use depends on your strategy and the current market conditions. It’s important to remember that no single indicator can provide a complete picture of the market.
This guide will introduce five popular trading indicators you should know.
Defining Technical Indicators
Technical indicators are tools traders and investors use to predict future price trends and patterns in financial markets. They analyse historical price, volume, and open interest data using mathematical formulas. These indicators provide a graphical representation of market activity over a specified period, helping investors interpret trends, identify investment opportunities, and make informed trading decisions.
In essence, technical indicators simplify the information found in price charts, allowing traders to easily understand and respond to market data. They visually display this data on or below a security’s price chart, highlighting patterns that may not be immediately apparent in the raw data.
For instance, trend indicators gauge the trajectory and vigour of a trend, while volume indicators illuminate trading activity levels. Hence, a productive approach entails amalgamating multiple indicators to corroborate signals and augment prediction reliability. This methodology furnishes traders with a more thorough comprehension of market conduct, enabling the formulation of robust trading strategies.
Superlative Technical Analysis Indicators
Now, let’s delve into the upper echelons of the leading five technical analysis indicators that serve as compasses for competent trading.
- MA (Moving Average Indicator)
The Moving Average (MA) is a commonly used technical analysis indicator that calculates the average price of a security over a specific period. It smooths out price fluctuations and helps traders identify the underlying trend. There are different types of moving averages, such as SMA, EMA, and WMA, each with different weights for the data points they consider.
If the price is above the moving average, it may indicate an upward trend, while a price below the moving average can signal a downward trend. However, as a lagging indicator, it generates signals after the trend has already started.
2. RSI (Relative Strength Index)
The Relative Strength Index (RSI) is a momentum oscillator that measures the speed and change of price movements. It calculates the ratio of upward changes to downward changes in price over a 14 period and scales it from 0 to 100.
An RSI reading above 70 suggests security is overbought and may experience a price decrease, while a reading below 30 suggests a security is oversold and may see a price increase. RSI is useful for spotting potential reversals and confirming trend direction.
3. PSAR (Parabolic SAR Indicator)
PSAR functions as a trend-trailing indicator, offering prospective entry and exit points. It manifests as dots plotted above or below the price trajectory. When these dots materialise below the price line, they indicate a bullish trend, signalling an opportune moment to buy.
Conversely, when the dots appear above the price line, they denote a bearish trend, signalling an opportune moment to sell. PSAR also aids traders in configuring trailing stop losses, with the dots gravitating towards the price as a trend persists and switching to the opposite side of the price trajectory during a trend reversal.
4. BBI (Bollinger Bands Indicators)
Bollinger Bands serve as volatility indicators, comprising a simple moving average (the middle band) and two standard deviation lines (upper and lower bands). When the price grazes the upper bar, it might foreshadow an overbought scenario with a potential downward reversal.
Contrarily, if the price brushes the lower band, it might signify an oversold condition and a probable upward turnaround. The width of the bands also furnishes insights into market volatility. Expanding bars denote heightening market volatility while contracting bands suggest diminishing market volatility.
5. Fibonacci Retracement Indicators
The Fibonacci retracement constitutes a technical analysis tool that employs horizontal lines to pinpoint potential zones of support or resistance at crucial Fibonacci levels prior to the price resuming its original trajectory.
These levels are computed by ascertaining the vertical span between a security’s peak and trough prices and dividing this span by pivotal Fibonacci ratios: 23.6%, 38.2%, 50%, 61.8%, and 100%. Traders seek out these levels as potential pivot points where prices could reverse.
Conclusion
When searching for the best technical indicator, it is important to understand that no single tool is superior in all situations. Instead, it is advisable to assemble a collection of indicators that align with your trading approach and the current market conditions. Different scenarios may call for different indicators.
A common practice is using multiple indicators to verify and validate market trends. By employing two or three indicators, you can gain a comprehensive outlook on the market without overwhelming your analysis.
However, it is important to exercise caution when using indicators. Overloading your analysis with too many indicators can lead to information overload and make it difficult to make decisions. It is crucial to strike a balance by using enough indicators to make informed trading decisions but not so many that the analysis becomes confusing.
It is also worth noting that successful trading requires a combination of strategic understanding, intuition, and analysis of raw data and trends.

